Oil Down. Markets Up.
In this July 2026 market commentary, Rich Lawrence reviews a clear market rotation in the U.S. stock market in June 2026, with the S&P 500 Index (S&P) down 1% and the Dow Jones Industrial Average (DOW) up 4%.
Investors were rotating from large-cap growth stocks to mid- to large-cap value stocks. However, on a year-to-date basis, both the S&P and the Dow are both up 9%. As always, markets exhibited volatility this year due to the spike in oil and gas prices.
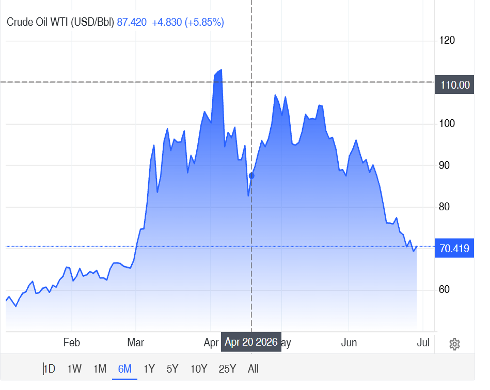
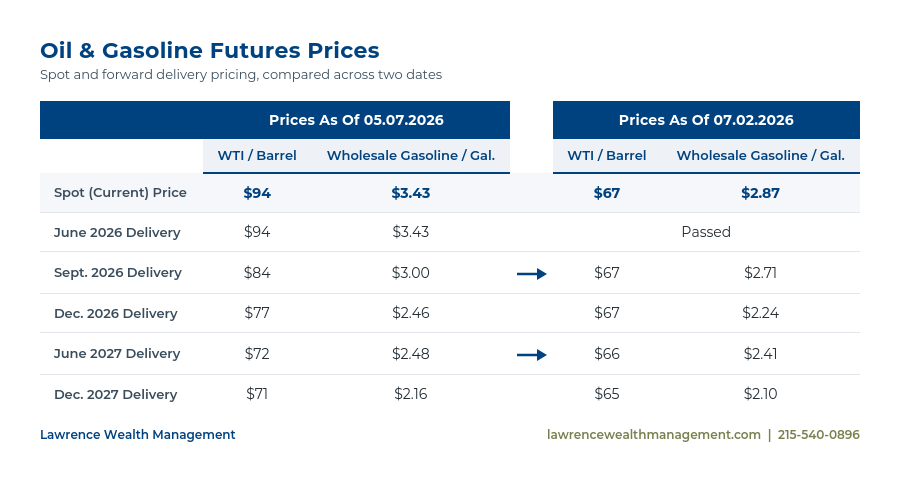
The US stock market declined by 9-10% by the end of March, when the price of oil, West Texas Intermediate (WTI), was on its way to its $112 peak on April 6, 2026, only to decline to the current $67/barrel. While oil prices have dropped swiftly, gasoline prices have declined very slowly and are now down only 23% from their peak. Oil must move through the distribution, refining, and inventory supply line to adjust to gas prices. The futures market indicates another 22% decline in wholesale gasoline by the end of 2027.
The Oil and Gas futures markets are pricing in a continuation of oil and gas price declines during the next 18 months.
The decline in energy prices should help reduce inflationary pressures, lessening the immediate need for the Federal Reserve to raise interest rates. Lower gasoline prices should also improve consumer sentiment, leaving households with more disposable income to support consumer spending and, in turn, economic growth.
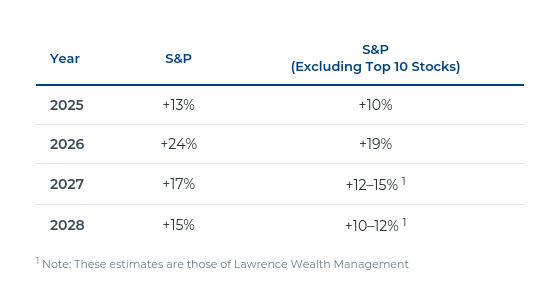
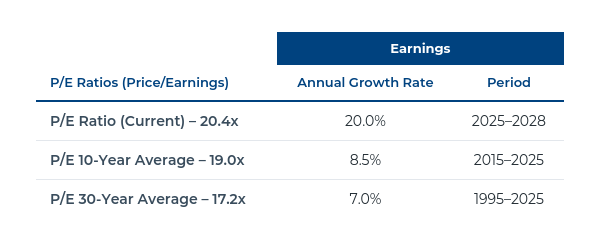
Corporate earnings, as measured by the S&P, are expected to grow 15% annually or cumulatively 45-60% for the three years 2026-2028. This period of earnings growth is historic and driven in large part by the productivity benefits of artificial intelligence.
Equity Valuation (price/earnings “P/E”) is greater than historical averages when taken in isolation …
However, the above-noted earnings growth is substantially greater than historical averages, thus supporting the above-average valuation in my opinion.
Investment Strategy
- We do not recommend chasing hot stocks but rather maintaining a well-diversified portfolio of both value and growth stocks.
- We are currently positioning portfolios to reduce allocations among large-cap growth stocks and to increase allocations to large-cap value stocks. We continue to invest in many of the well-publicized growth stocks but are reducing our clients’ exposure to them.
As always, we advise our clients to maintain a “safety bucket” of funds, cash, money market funds, and bonds, to fund spending needs for at least two years, and preferably three to four years. The remaining funds are recommended to be invested in stocks for long-term appreciation potential. This strategy is based on our understanding that the stock market declines periodically by 10-50%. It is during these market declines that funds from one’s “safety bucket” can fund expenses while markets recover.
BIG NEWS: Kevin Warsh was sworn in as the new Chairman of the Federal Reserve Board (FED) on May 22, 2026.
In my opinion, this is excellent news for proponents of the FED delivering on its “stable prices” mandate. The FED has the dual mandate of managing monetary policy to guide the economy to generate “full employment” and “stable prices”. Chairman Warsh believes the FED has lost its way and needs to get back to delivering stable prices. This strategy should result in a stronger U.S. dollar and secure the U/S. dollar as the world’s reserve currency.
The Federal Reserve’s balance sheet has expanded dramatically—from less than $1 trillion before the 2008 financial crisis to approximately $6.7 trillion today. In Kevin Warsh’s view, this expansion of the money supply has blurred the line between monetary and fiscal policy.
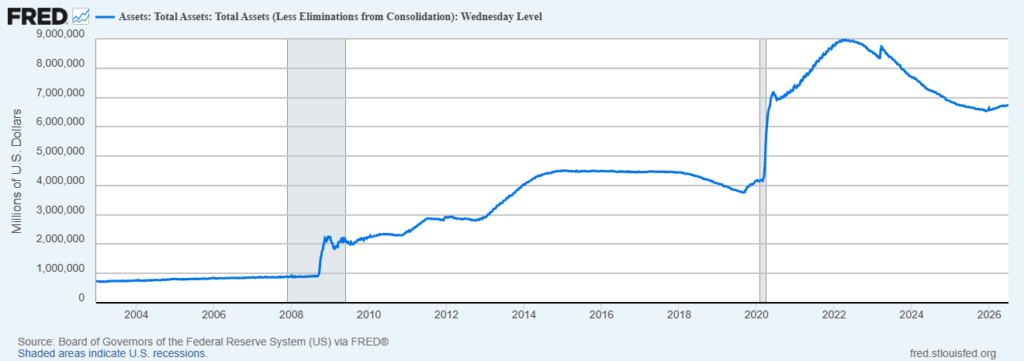
While the Federal Reserve’s current $6.7 trillion balance sheet presents a significant challenge, it developed over nearly two decades and cannot be unwound overnight. We expect the Federal Reserve to continue reducing its balance sheet over time and to refrain from expanding it to finance federal government spending, as it has done during previous periods of large-scale asset purchases.
The FED’s Open Market Committee, which sets monetary policy, is unanimous in its goal to direct policy to achieve “stable prices”. Markets responded positively to this potential change in the Fed’s monetary policy.
The U.S. Dollar Index increased 3% in 2026. The price of gold declined, down approximately 20%. Historically, gold prices tend to rise when currencies weaken, particularly the U.S. dollar, which serves as the world’s primary reserve currency. Conversely, when central banks and governments around the world have greater confidence in the U.S. dollar, demand for gold often decreases, putting downward pressure on its price.
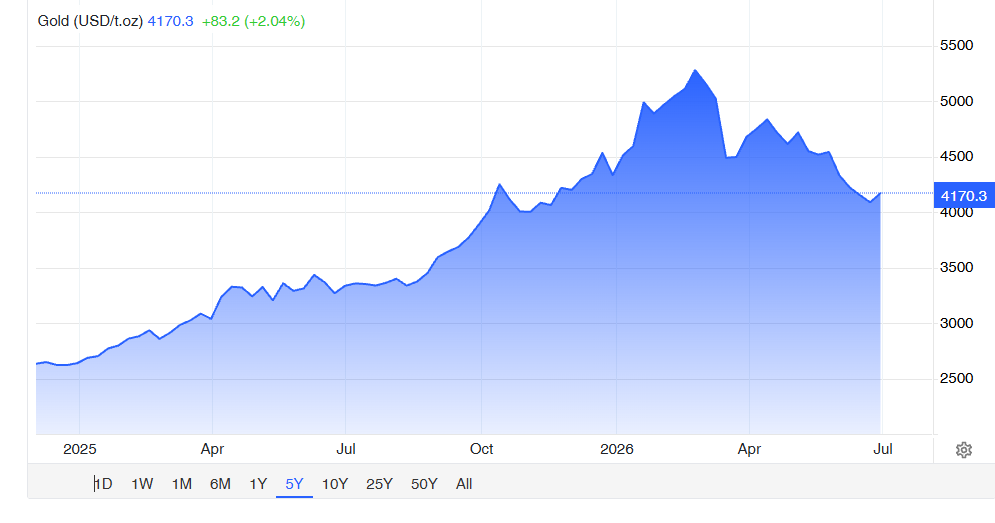
The strength of the U.S. Dollar Index and the decline in gold prices suggest that markets are becoming increasingly optimistic that the Federal Reserve may change course and adhere more closely to its mandate of maintaining stable prices. Such a shift in monetary policy would likely provide additional support for the U.S. dollar.
Market Risks
1. Artificial Intelligence “AI” capital expenditures are expected to be $700 billion in 2026 and $1 trillion in 2028. If AI capital expenditures decline, there will likely be a ripple effect through the economy and markets.
2. Interest Rates rise more than expected. The bond market currently is “pricing in” one or two .25 point increases of the federal funds rate, which the FED sets.
DISCLOSURE:
Opinions about the future are not predictions, guarantees, or forecasts. Investing in stock and bond markets has risks that could lead to investors losing money. We always advise investors to maintain a cushion of safety funds (cash, money market funds, and investment-grade bonds) to fund expenses for 2-4 years. Unforeseen events occur that can thrust the stock market down. The current Iran Crisis is a perfect example. Stocks are long-term investments and should not be used for short-term spending needs.
Rich Lawrence, CFA July 4, 2026